About this Report
The use of Configure-Price-Quote (CPQ) tools for the sales process continues to increase. This is true for all kinds of products, large and small, expensive and cheap as well as common and exclusive. One way to gain and hold the attention of a CPQ User is to visualize the product while it is configured. This is powerful because it provides an emotional attachment for the user to their custom configured product.. The available visualization aids run the gamut from simple 2D to very cool 3D images and all the way to state of the art immersive Virtual Reality (VR) technology to the mix of real with virtual environments afforded by Augmented Reality (AR) technology. This offers new and interesting ways to present a product for current visual CPQ customers while it also challenges CPQ vendors to find ways to stay ahead of their competition.
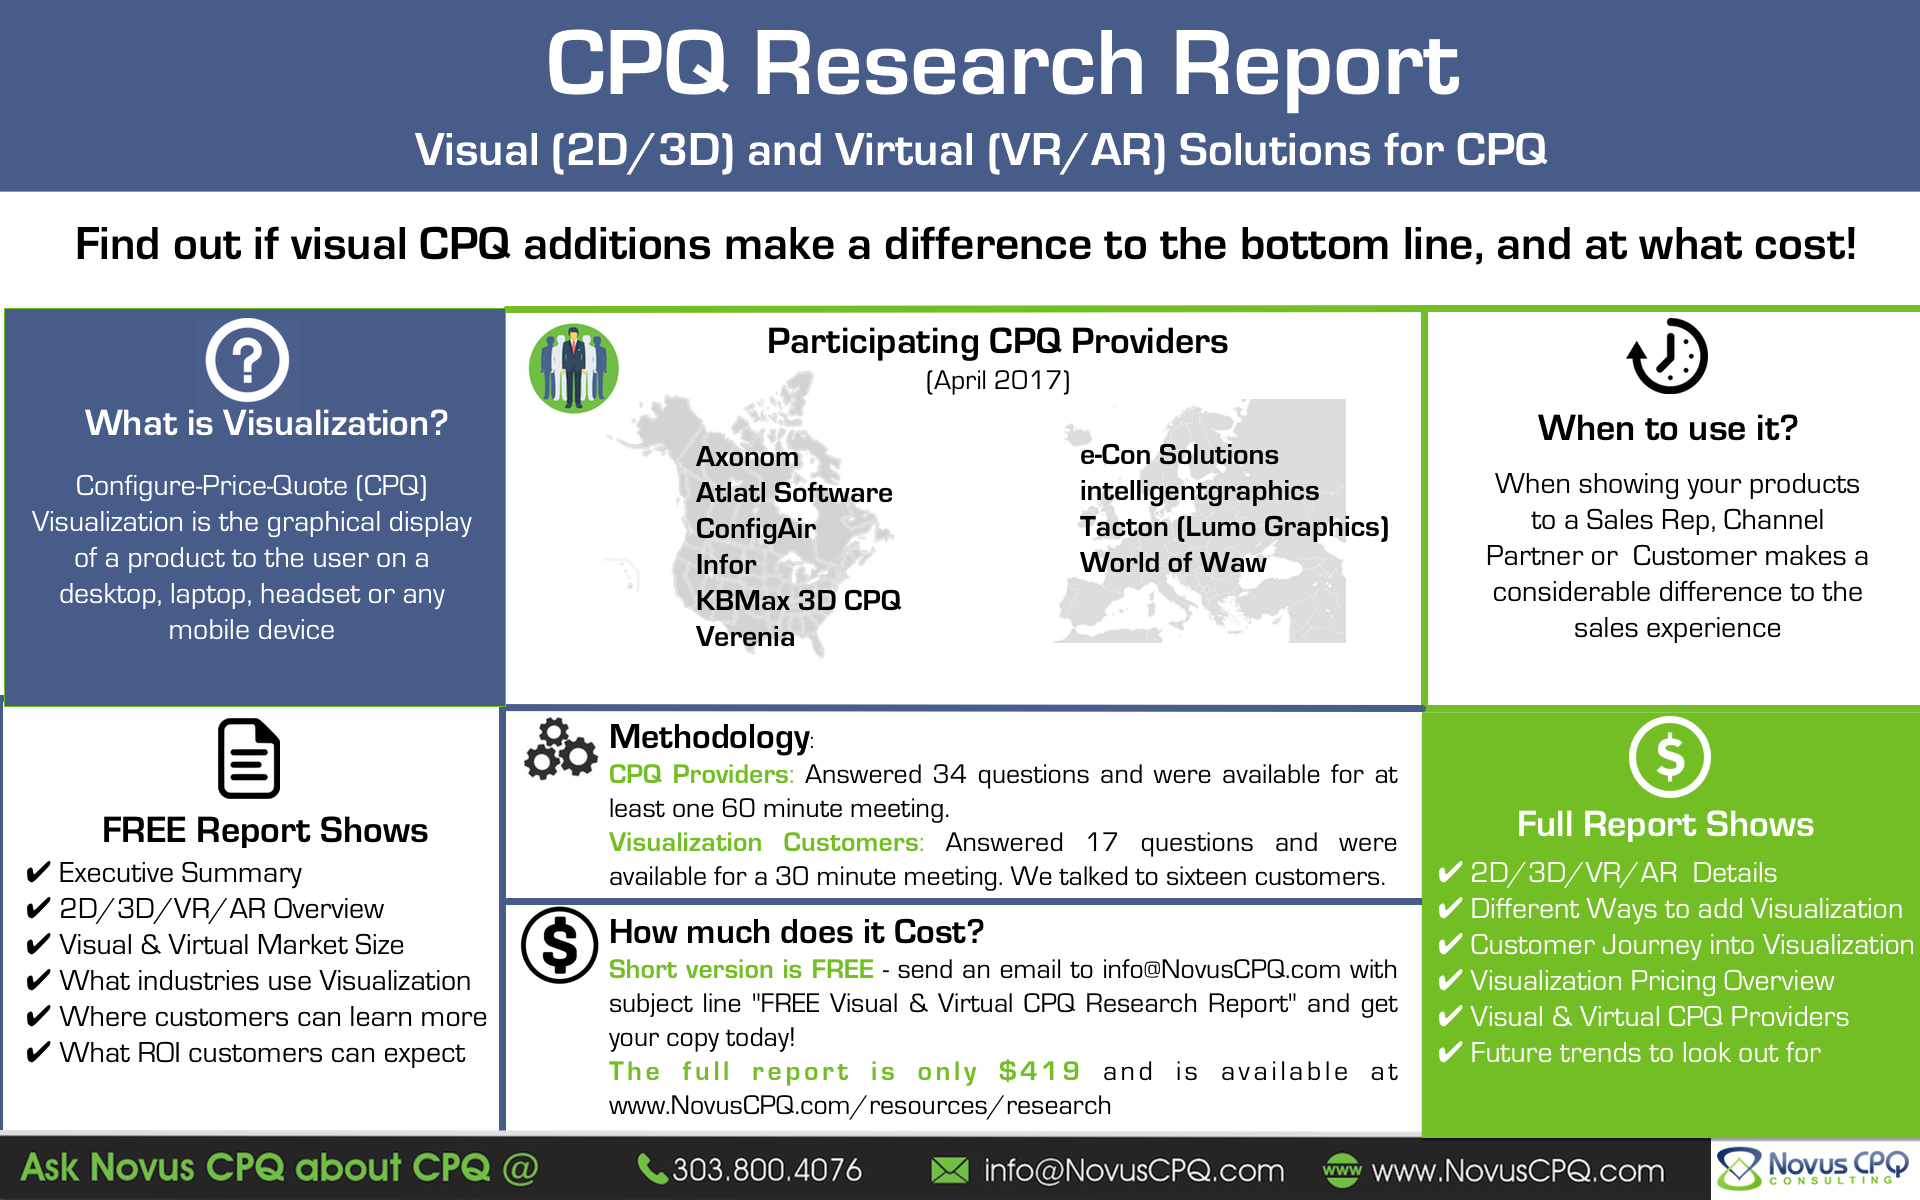
The important question all CPQ vendors and their customers’ need answered is, “do these visual additions to CPQ indeed make a difference to the bottom line, and at what cost?”
We at Novus CPQ Consulting wanted to find the answer to this important question so we surveyed six Configure-Price-Quote (CPQ) vendors and ten of their customers to discover:
- the role product visualization plays in CPQ Solutions, now and going forward
- the visualization technologies that are most promising for improving CPQ productivity and efficiency
- the expectation of CPQ vendors and customers from visual and virtual CPQ Solutions
- the Key Challenges for CPQ vendors and customers to adopt 3D CPQ Solutions
- the maintenance requirements for visual and virtual CPQ Solutions
Report Methodology
To determine the answers to the above questions, we researched information for various visualization techniques used in CPQ (2D, 3D, Virtual Reality, Augmented Reality). We prepared and sent survey questionnaires to leading CPQ vendors and their customers and conducted interviews with each of them. This report is the culmination of our analysis and evaluation of the data thus received. We will update our findings with additional CPQ vendors and customers in a second version of this report.
The Report was prepared by:
Frank Sohn, Novus CPQ Consulting, Inc.
Anjali Mulgaonkar, Novus CPQ Consulting, Inc.
________
The following topics are covered in this Report
Executive Summary ….. 4
What is visual & virtual Configure-Price-Quote (CPQ) ….. 6
Brief overview of techniques used in visual & virtual CPQ (Definitions and Examples) ….. 6
Basics for visual & virtual CPQ Solutions ….. 10
Journey of the typical customer into visual and virtual CPQ ….. 11
Different ways of adding visual experience to CPQ Solutions ….. 13
Use 2D only ….. 13
Basics ….. 13
Key Challenges ….. 14
Training ….. 14
Maintenance ….. 14
Use 3D only ….. 15
Basics ….. 15
Key Challenges ….. 16
Training ….. 17
Maintenance ….. 17
Use a combination of 2D and 3D ….. 17
Key take away of 2D vs. 3D decision ….. 17
Virtual Reality (VR) ….. 18
Basics ….. 18
Key Challenges ….. 19
Training ….. 19
Maintenance ….. 19
Augmented Reality (AR) ….. 20
Basics ….. 20
Key Challenges ….. 20
Training ….. 20
Maintenance ….. 20
How big is the visual and virtual CPQ Market? ….. 21
Which industries benefit from visual & virtual CPQ Solutions? ….. 22
CPQ vendors with visual and virtual capabilities ….. 23
Planning budget for visual and virtual CPQ Solutions ….. 24
Where can customers and prospects learn more ….. 25
Future trends to look out for ….. 26
What ROI for CPQ visualization solutions can you expect ….. 27